In this tutorial, you will learn in brief about Spring Boot Actuator.
Spring Boot includes a number of additional features to help you monitor and manage your application when you push it to production. You can choose to manage and monitor your application by using HTTP endpoints or with JMX. Auditing, health, and metrics gathering can also be automatically applied to your application.
What is an Actuator?
Definition of Actuator
An actuator is a manufacturing term that refers to a mechanical device for moving or controlling something. Actuators can generate a large amount of motion from a small change.
The main benefit of this library is that we can get production grade tools without having to actually implement these features ourselves.
Getting Started
The spring-boot-actuator module provides all of Spring Boot’s production-ready features. The simplest way to enable the features is to add a dependency to the spring-boot-starter-actuator ‘Starter’.
To add the actuator to a Maven-based project, add the following ‘Starter’ dependency:
<dependencies>
	<dependency>
		<groupId>org.springframework.boot</groupId>
		<artifactId>spring-boot-starter-actuator</artifactId>
	</dependency>
</dependencies>
Actuator Endpoints
Actuator creates several so-called endpoints that can be exposed over HTTP or JMX to let you monitor and interact with your application. Spring Boot includes a number of built-in endpoints and lets you add your own. For example, the health endpoint provides basic application health information.
Note that, every actuator endpoint can be explicitly enabled and disabled. Moreover, the endpoints also need to be exposed over HTTP or JMX to make them remotely accessible.
Now, let’s run the application and try to access the Actuator endpoints which are enabled default and exposed over HTTP.
Type the following command from the root directory of the application to run it –
mvn spring-boot:run
The Application will start on port 8080 by default. We but explicitly set the server port to 8081 by configuring the Application.porperties file parameters. So this example of this tutorial, it will start on Port 8081.
Once the application is started, open the URL – http://localhost:8081/actuator to see the exposed Actuator endpoints. We are using Postman to see the HTTP Endpoints. You can use your preferred tool for accessing HTTP requests.
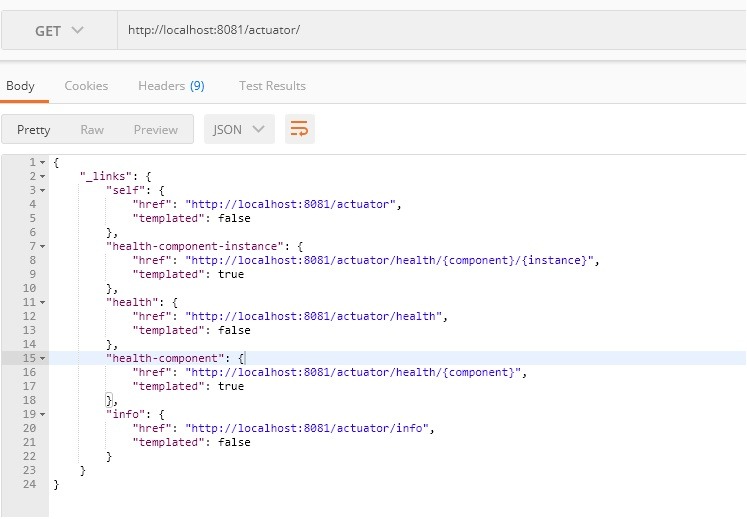
Now, Let’s explore the health endpoint by opening the http://localhost:8081/actuator/health URL.
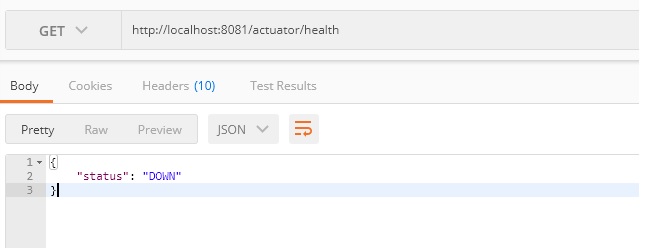
The status will be UP as long as the application is healthy. It will show DOWN if the application gets unhealthy due to any issue like connectivity with the database or lack of disk space etc.
By default from Spring Boot 2, only /info and /health endpoints are exposed. We will learn how to expose and enable other endpoints.
Now, let’s look at other endpoints provided and what they offer. Following is a list of some super useful actuator endpoints.
| ID | Description | Enabled by default | Exposed to JMX | Exposed to Web |
auditevents | Exposes audit events information for the current application. | Yes | Yes | No |
beans | Displays a complete list of all the Spring beans in your application. | Yes | Yes | No |
caches | Exposes available caches. | Yes | Yes | No |
conditions | Shows the conditions that were evaluated on configuration and auto-configuration classes and the reasons why they did or did not match. | Yes | Yes | No |
configprops | Displays a collated list of all @ConfigurationProperties. | Yes | Yes | No |
env | Exposes properties from Spring’s ConfigurableEnvironment. | Yes | Yes | No |
flyway | Shows any Flyway database migrations that have been applied. | Yes | Yes | No |
health | Shows application health information. | Yes | Yes | Yes |
httptrace | Displays HTTP trace information (by default, the last 100 HTTP request-response exchanges). | Yes | Yes | No |
info | Displays arbitrary application info. | Yes | Yes | Yes |
integrationgraph | Shows the Spring Integration graph. | Yes | Yes | No |
loggers | Shows and modifies the configuration of loggers in the application. | Yes | Yes | No |
liquibase | Shows any Liquibase database migrations that have been applied. | Yes | Yes | No |
metrics | Shows ‘metrics’ information for the current application. | Yes | Yes | No |
mappings | Displays a collated list of all @RequestMapping paths. | Yes | Yes | No |
scheduledtasks | Displays the scheduled tasks in your application. | Yes | Yes | No |
sessions | Allows retrieval and deletion of user sessions from a Spring Session-backed session store. Not available when using Spring Session’s support for reactive web applications. | Yes | Yes | No |
shutdown | Lets the application be gracefully shutdown. | No | Yes | No |
threaddump | Performs a thread dump. | Yes | Yes | No |
Enabling Endpoints
By default, all endpoints listed above except for shutdown are enabled. To configure the enablement of an endpoint, use its management.endpoint.<id>.enabled property. The following example enables the shutdown endpoint:
management.endpoint.shutdown.enabled=true
If you prefer endpoint enablement to be opt-in rather than opt-out, set the management.endpoints.enabled-by-default property to false and use individual endpoint enabled properties to opt back in. The following example enables the info endpoint and disables all other endpoints:
management.endpoints.enabled-by-default=false
management.endpoint.info.enabled=true
Exposing Endpoints
Since Endpoints may contain sensitive information, careful consideration should be given about when to expose them. By default, all the actuator endpoints are exposed over JMX but only the health and info endpoints are exposed over HTTP.
# Use "*" to expose all endpoints, or a comma-separated list to expose selected ones
management.endpoints.web.exposure.include=health,info
management.endpoints.web.exposure.exclude=
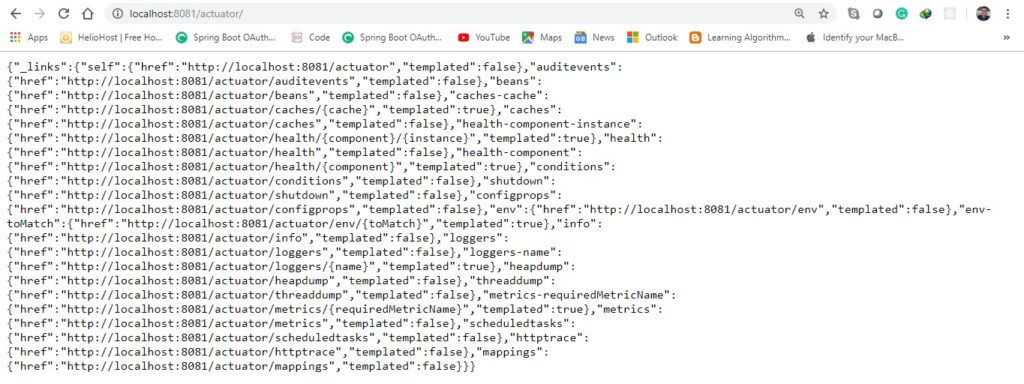
Now, let’s expose all the endpoints in the application by changing the properties value. Change management.endpoints.web.exposure.include value to * and check the output at http://localhost:8081/actuator/. You can see the page will display all the enables exposed endpoints.
Exploring common Actuator Endpoints
/health Endpoint
The /health endpoint is used to check the health or state of the running application. It’s usually exercised by monitoring software to alert us if the running instance goes down or gets unhealthy for other reasons. E.g. Connectivity issues with our DB, lack of disk space…
Spring Boot Actuator comes with several predefined health indicators like DataSourceHealthIndicator, DiskSpaceHealthIndicator, MongoHealthIndicator, RedisHealthIndicator, CassandraHealthIndicator etc. It uses these health indicators as part of the health check-up process. Click Here to know more.
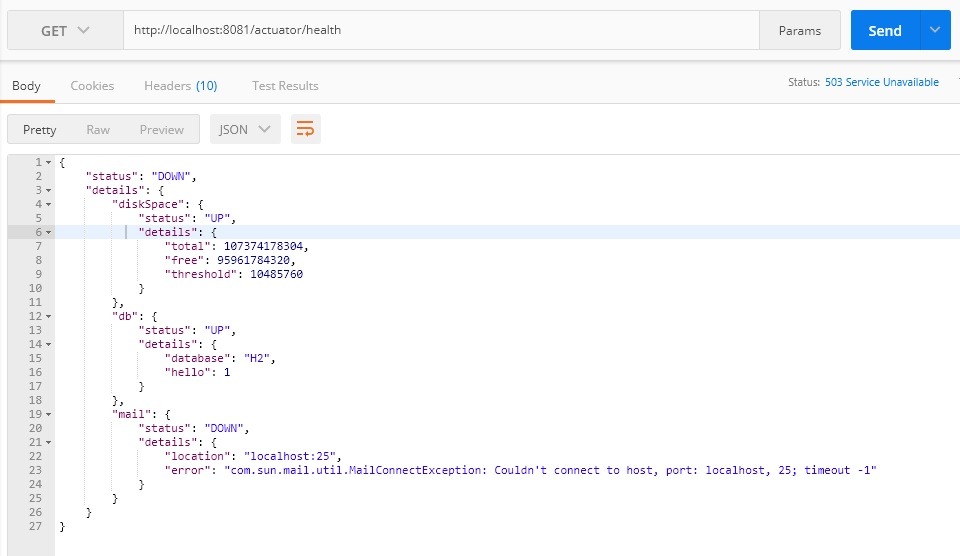
Displaying detail health Information
The /health endpoint only shows a simple UP or DOWN status. To get the complete details including the status of every health indicator that was checked as part of the health check-up process, add the following property in the application.properties file
# HEALTH ENDPOINT
management.endpoint.health.show-details=always
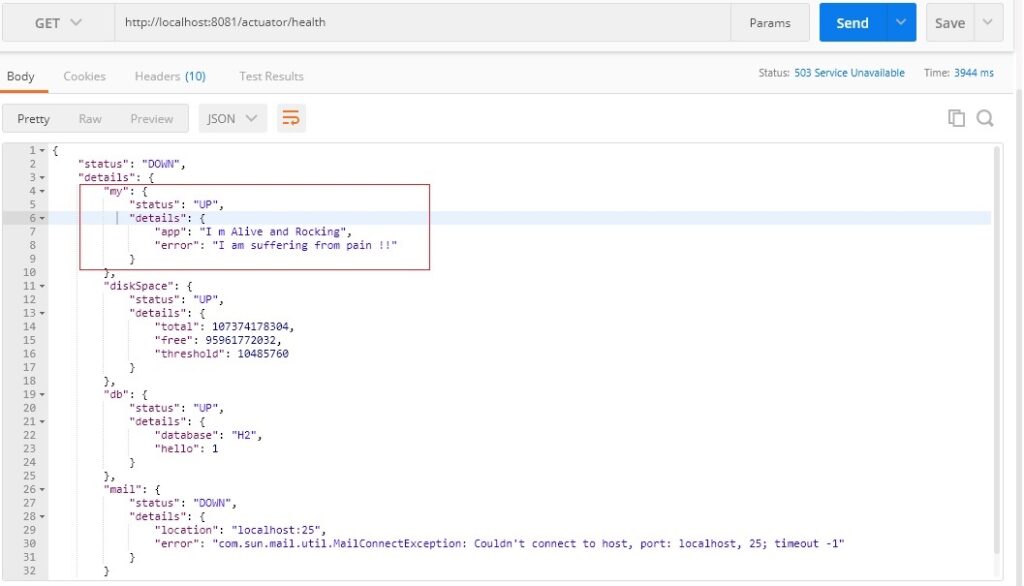
Now, health endpoint will look like below.
Writing Custom HealthIndicators
To provide custom health information, you can register Spring beans that implement the HealthIndicator interface.
@Component
public class MyHealthIndicator implements HealthIndicator {

    @Override
    public Health health() {

        int errorCode = check(); // perform some specific health check
        if (errorCode != 0) {
            return Health.down().withDetail("Error Code", errorCode).build();
        }
        return Health.up()
                .withDetail("app", "I m Alive and Rocking")
                .withDetail("error", "I am suffering from pain !!")
                .build();
    }

    public int check() {
        // Your Own logic to check health
        return 0;
    }
}
Once you add the above health indicator in your application, the health endpoint will start showing its details as well
/info Endpoint
We can also customize the data shown by the /info endpoint – for example:
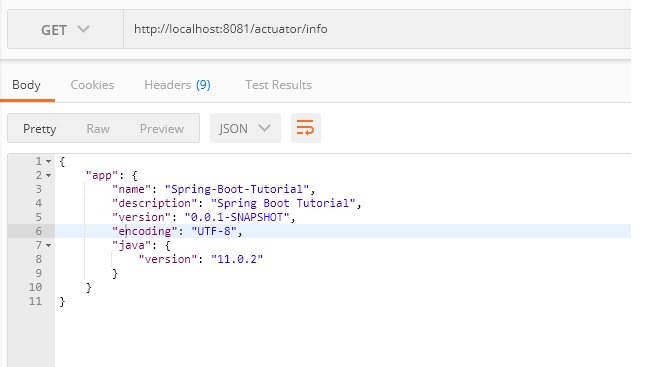
Note that, In this tutorial we are using Spring Boot’s Automatic property expansion feature to expand properties from the maven project.
/metric Endpoint
The metrics endpoint publishes information about OS, JVM as well as application level metrics.
Output when hitting the URL -> http://localhost:8081/actuator/metrics
{
    "names": [
        "jvm.threads.states",
        "jdbc.connections.active",
        "jvm.memory.used",
        "jvm.gc.memory.promoted",
        "jvm.memory.max",
        "jvm.gc.max.data.size",
        "jdbc.connections.max",
        "jdbc.connections.min",
        "jvm.memory.committed",
        "system.cpu.count",
        "logback.events",
        "tomcat.global.sent",
        "jvm.gc.pause",
        "jvm.buffer.memory.used",
        "tomcat.sessions.created",
        "jvm.threads.daemon",
        "system.cpu.usage",
        "jvm.gc.memory.allocated",
        "tomcat.global.request.max",
        "hikaricp.connections.idle",
        "hikaricp.connections.pending",
        "tomcat.global.request",
        "tomcat.sessions.expired",
        "hikaricp.connections",
        "jvm.threads.live",
        "jvm.threads.peak",
        "tomcat.global.received",
        "hikaricp.connections.active",
        "hikaricp.connections.creation",
        "process.uptime",
        "tomcat.sessions.rejected",
        "process.cpu.usage",
        "http.server.requests",
        "tomcat.threads.config.max",
        "jvm.classes.loaded",
        "hikaricp.connections.max",
        "hikaricp.connections.min",
        "jvm.classes.unloaded",
        "tomcat.global.error",
        "tomcat.sessions.active.current",
        "tomcat.sessions.alive.max",
        "jvm.gc.live.data.size",
        "hikaricp.connections.usage",
        "tomcat.threads.current",
        "hikaricp.connections.timeout",
        "jvm.buffer.count",
        "jvm.buffer.total.capacity",
        "tomcat.sessions.active.max",
        "hikaricp.connections.acquire",
        "tomcat.threads.busy",
        "process.start.time"
    ]
}
To get the details of an individual metric, you need to pass the metric name in the URL like this http://localhost:8081/actuator/metrics/{MetricName}
For example, to get the details of jvm.memory.used metric, use the URL http://localhost:8080/actuator/metrics/jvm.memory.used.
{
    "name": "jvm.memory.used",
    "description": "The amount of used memory",
    "baseUnit": "bytes",
    "measurements": [
        {
            "statistic": "VALUE",
            "value": 193649008
        }
    ],
    "availableTags": [
        {
            "tag": "area",
            "values": [
                "heap",
                "nonheap"
            ]
        },
        {
            "tag": "id",
            "values": [
                "CodeHeap 'profiled nmethods'",
                "G1 Old Gen",
                "CodeHeap 'non-profiled nmethods'",
                "G1 Survivor Space",
                "Compressed Class Space",
                "Metaspace",
                "G1 Eden Space",
                "CodeHeap 'non-nmethods'"
            ]
        }
    ]
}
/loggers Endpoint
The loggers endpoint, which can be accessed at http://localhost:8081/actuator/loggers, displays a list of all the configured loggers in your application with their corresponding log levels.
You can also view the details of an individual logger passing the logger name in the URL like this – http://localhost:8081/actuator/loggers/{name}
For example, to get the details of the com.dailycodebuffer logger, use the URL http://localhost:8081/actuator/loggers/com.dailycodebuffer.
{
    "configuredLevel": null,
    "effectiveLevel": "INFO"
}
Creating A New Endpoint
Besides using the existing endpoints provided by Spring Boot, we could also create an entirely new one.
Please go through this article to understand more on creating custom Actuator Endpoints: Click Here
Securing Actuator Endpoints
Actuator endpoints are sensitive and must be secured from unauthorized access. If Spring Security is present in your application, then the endpoints are secured by default using a form-based HTTP basic authentication.
The following example shows a sample spring security configuration that uses a convenient RequestMatcher factory called EndPointRequest provided by spring-boot-actuator module to configure access rules for Actuator endpoints
@Configuration
public class ActuatorEndPointSecurityConfig  extends WebSecurityConfigurerAdapter {

    @Override
    protected void configure(HttpSecurity http) throws Exception {
        http
                .authorizeRequests()
                .requestMatchers(EndpointRequest.to(ShutdownEndpoint.class))
                .hasRole("ACTUATOR_ENDPOINT_ADMIN")
                .requestMatchers(EndpointRequest.toAnyEndpoint())
                .permitAll()
                .requestMatchers(PathRequest.toStaticResources().atCommonLocations())
                .permitAll()
                .antMatchers("/")
                .permitAll()
                .antMatchers("/**")
                .authenticated()
                .and()
                .httpBasic();
    }
}
To be able to test the above configuration with HTTP basic authentication, you can add a default spring security user in application.properties
# Spring Security Default user name and password
spring.security.user.name=actuator
spring.security.user.password=actuator
spring.security.user.roles=ACTUATOR_ENDPOINT_ADMIN
You can find the complete source code on Github.


Pingback: Shutdown a Spring Boot Application - Daily Code Buffer